Facts:
Downtown Hammond was named in the top 10 Greatest American Main Streets in 2019. What does that mean? It means Downtown Hammond was named one of the top 10 places in the USA to visit and do business.
Southeastern Louisiana University is just a few blocks from Downtown. The commuter school brings in students, teachers and parents on a daily basis.
The Amtrack train stops in Downtown Hammond bringing in visitors weekly from across the country who get off the train and shop and dine in the district.
Downtown Hammond is home to over 700 residents who walk to shop, eat and experience Downtown daily. This density of residences increases the number of potential customers to your business.
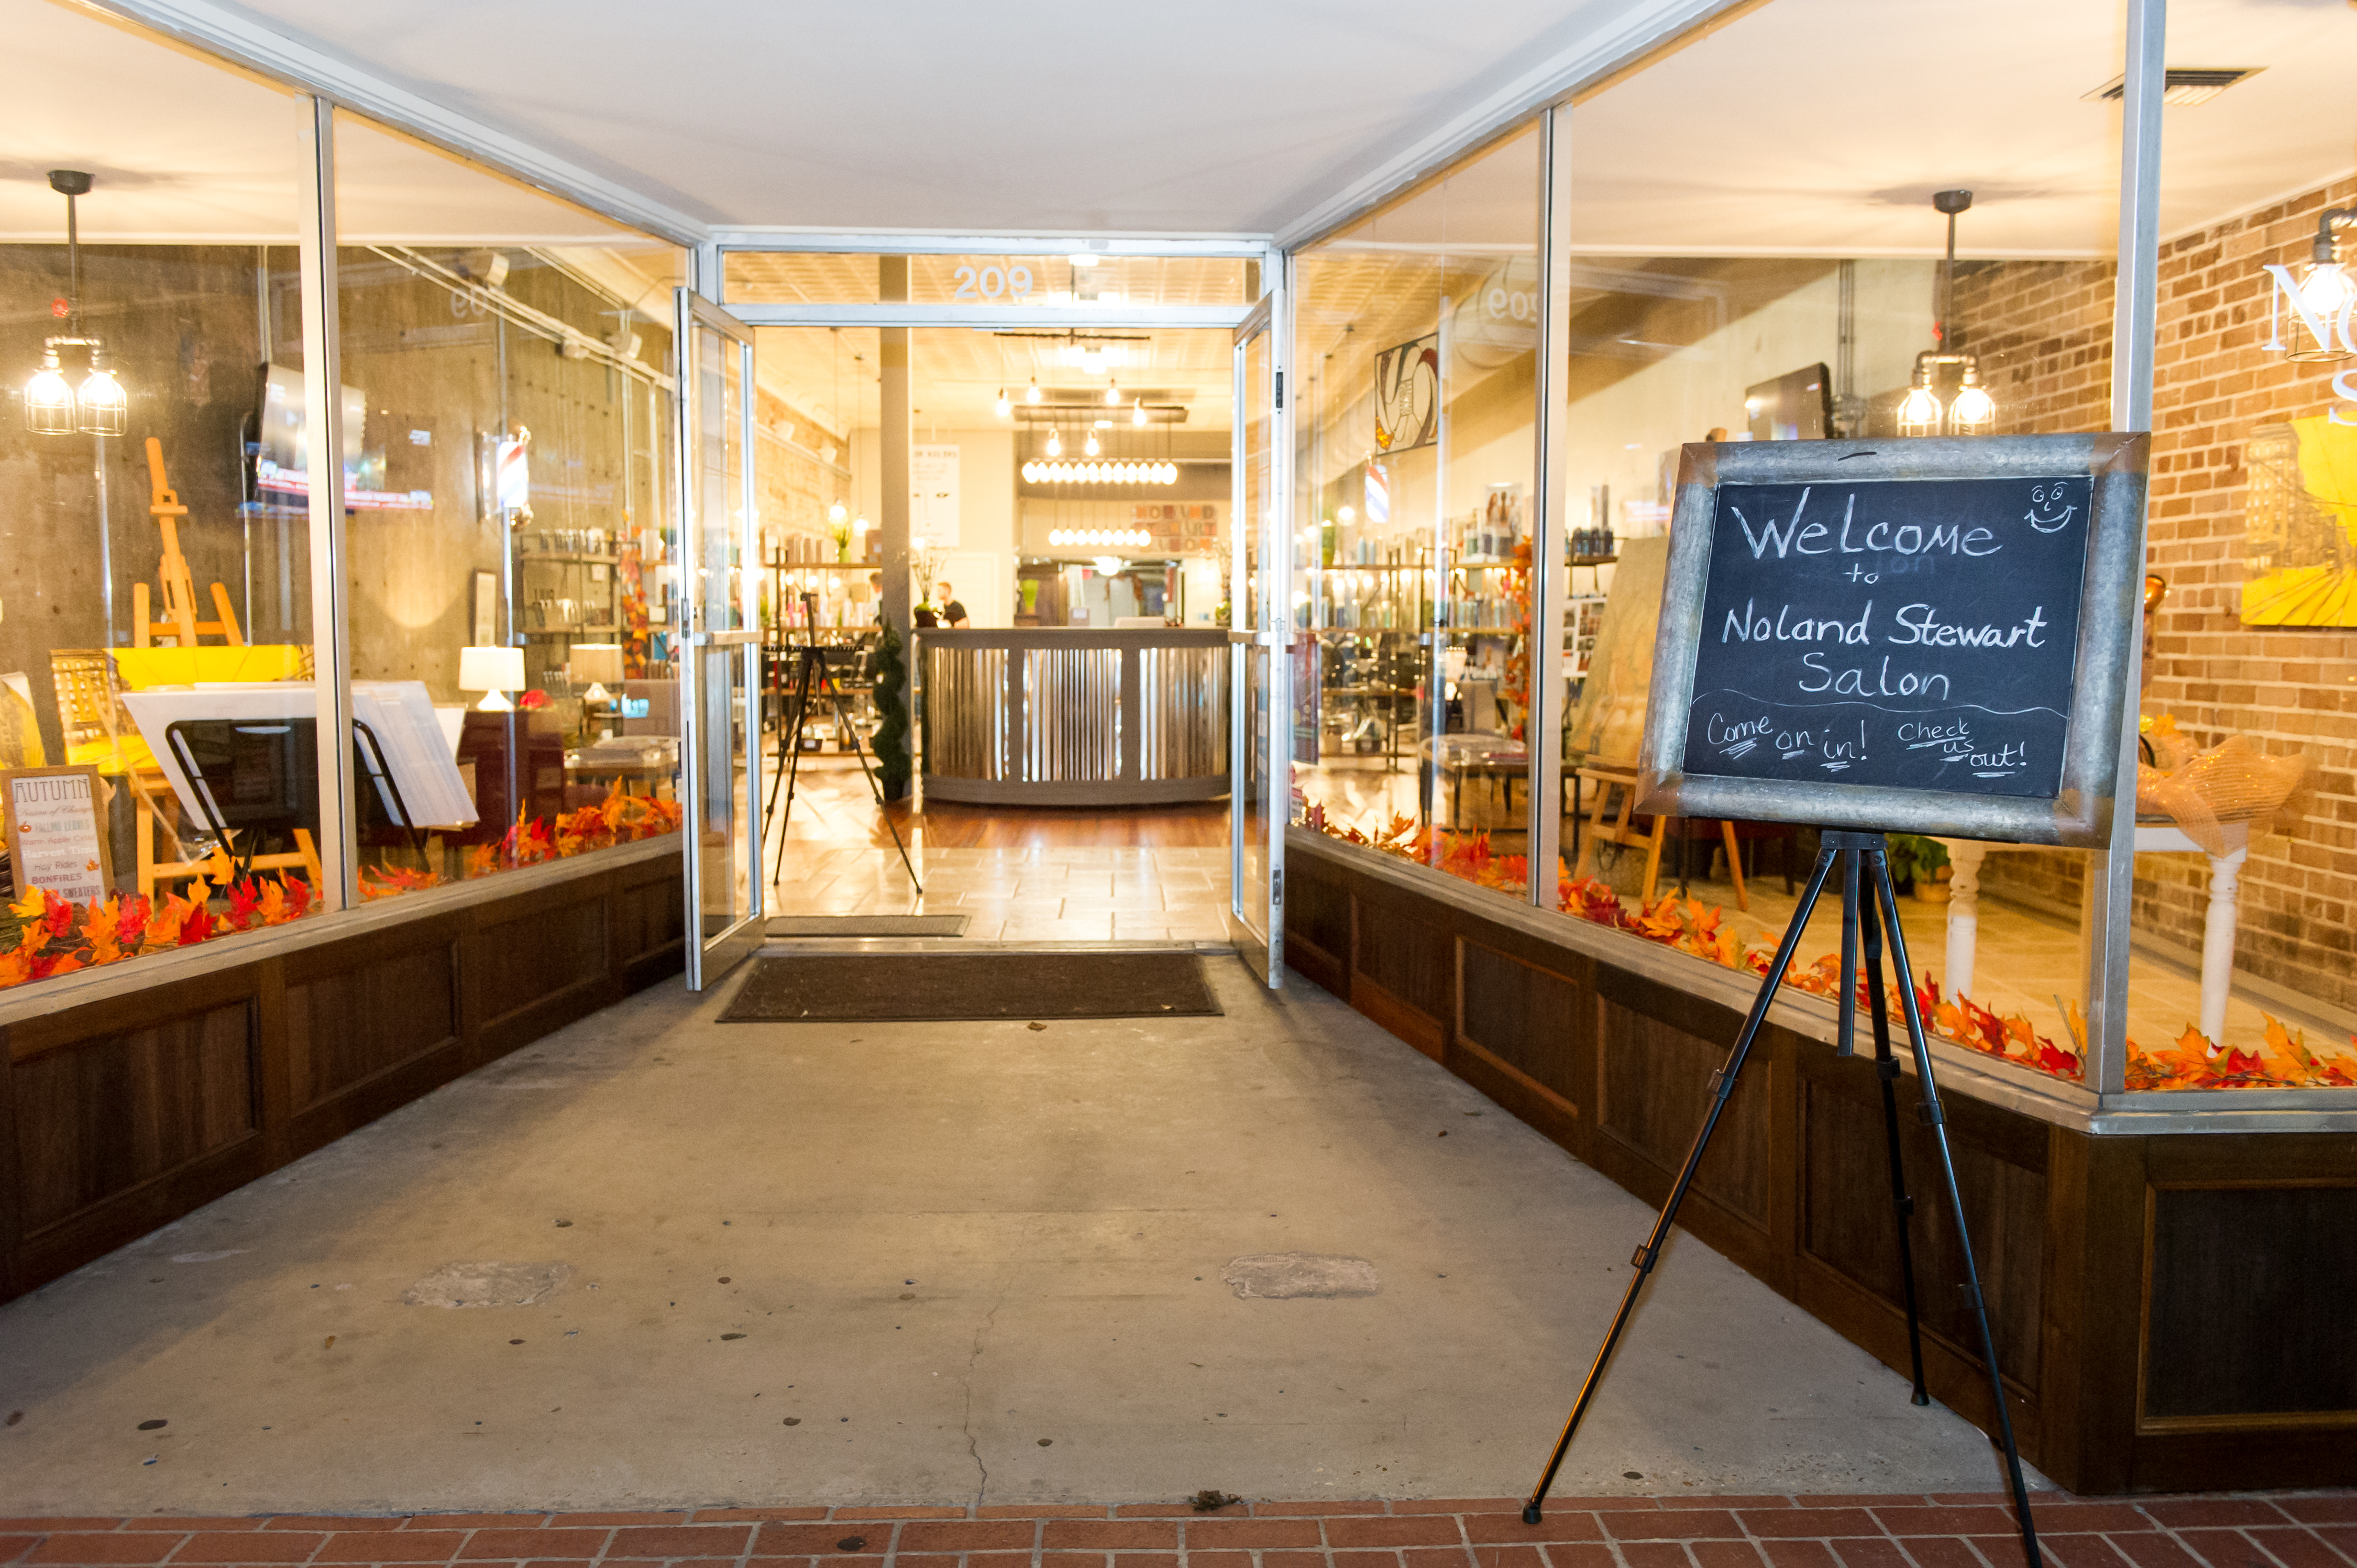
Downtown Hammond is a true work and play district catering to college students, white collar workers and visitors from 7am-2am. (Typical retail hours are from 10am-6pm or 11am-7pm.)
23% of our trade area’s population is in the peak employment age range of 35 –54 years old. Another 25% of the trade area’s population is in the age range of 20 –34 years old, just below the peak employment range.
Studies show that 88% of millennial shoppers want walkability. Downtown Hammond ranks a 12 out of 15 on the Neighborhood Environment Walkability Scale.
There is ample parking in the center of Downtown resulting in less reliance on your vehicle and more walkable "window shopping" leading to more customers.
Downtown Hammond allows (with guidelines) outdoor dining, seating, displays and more expanding the footprint of your business.
View our legislation here
View district map here
View or Master Plans here: 2020, 2002
View our annual reports here: 2019, 2018, 2017

Market Analysis and ERSI data - This is a full report on our target area demographics, leakage and surplus informaiton, house and home expenditures, maps and more. This data was last pulled in 2017 using the 2016 population.